AMDGPU crashing in games with ring gfx_0.0.0 timeout

I’ve posted this topic on Reddit before, but maybe I can get help here:

Hi, so I’ve been suffering from this issue for a little while now (Framework Desktop), but not right from the beginning and I can’t for the life of me figure out what causes (caused?) it. I use EndeavourOS on Hyprland. My framework desktop is mainboard-only, and I use a Corsair 450w SFX psu. It has 37A to the 32A on 12v Framework recommends. I also use a pretty chonky fan (Silent Wings 4 Pro).

Through a lot of observation, I found out in which exact scenario it happens, and it’s as follows:


When it happens:

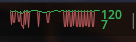
SPECIFICALLY, when I play a game that has some sort of scene where there are a lot of very quick FPS dips due to CPU processing, it may crash on one of these dips! Two games where I’ve observed this happen (and others never crash): Blue Protocol, when crafting, every time an item gets made, I have an invisible FPS dip, but Steam’s FPS graph shows that there is an instantaneous dip.

Here’s a video showing the dips: https://files.catbox.moe/nf0304.mp4 and here’s an image showing them in detail: https://files.catbox.moe/om3ctt.png. In the video above, I’ve fixed the game to 30 fps, which seems to alleviate the issue somewhat, since the dips aren’t so wild, it seems to be much less likely to die.

A second game where I have it happen is Zenless Zone Zero; but there, it only really happens in moments of loading, like the agent select, scrolling between agents can cause it, or starting a mission. Never during a mission, really. Only in moments of slight stutter.

I want to underline that it only happens ever in those games that have high frequencies of stutter in a short amount of time. I played a game yesterday that maxes the gpu all the time (100+ watts sustained load), for literally 8 hours in a row (final fantasy vii rebirth), no trouble AT ALL.

It’s only these two games I mentioned atm, and both of them are Unity engine as well…


Thesis

What this brings me to think about is power management, and looking at other threads, yes, people keep suggesting to change power management values. But this hasn’t really worked for me yet. I will attach dmesg and such of when it happens at the end of this writeup. What I think happens is during this small window of “no frames” being rendered by the GPU (CPU stalling) is that the GPU goes into a lower power window, and then right back up. I don’t know WHY this would break, but it seems in conjunction with the current driver implementation, it doesn’t like it. It also doesn’t sound good, to be fair.


What I’ve tried

So here are, in no particular order, things I’ve changed on the system to try to get rid of the issue. I’ve also tried combinations of them (albeit not every combination… probably).

  • Apply kernel values
    • amdgpu.ppfeaturemask=0xffffbfff (and other variants I’ve found, I haven’t documented them all)
    • amdgpu.mes=0 or 1 (didn’t change anything. maybe the “new” MES scheduler is forced on this newer GPU? I definitely know it always announces itself in the dmesg when it breaks, whether or not it’s on or off)
    • amdgpu.pm=0 (it causes the kernel to complain literally every second that it can’t switch power states, also seems to be stuck in a low asf power state then)
    • cwsr_enable=0 - didn’t cause any changes from what I can see
  • Different kernels:
    • linux-drm-next-git, linux-drm-tip-git
    • Since what complains is the kernel, I thought the one with the newest bleeding edge graphics implementations would work, but it didn’t change anything
  • MESA
    • replacing mesa lib32-mesa vulkan-mesa-layers lib32-vulkan-mesa-layers vulkan-radeon lib32-vulkan-radeon vulkan-mesa-implicit-layers lib32-vulkan-mesa-implicit-layers with this family of packages
    • downgrading mesa as far as it goes (but at some point, my libc is too new, so it doesn’t go that far…)
  • linux-firmware-git
    • having the newest firmwares, maybe?
  • proton versions
    • like tkg, em, etc…
  • Considered that maybe the PSU is at fault (during power state switching, the PSU isn’t fast enough, causing brownout issues, making the GPU trip?). I’ve tried two other PSUs, but the FW mobo didn’t like them. It didn’t turn on. I will try my 800w psu in my big tower that drives a 200w cpu and a 300w gpu without issues, though. To put all of that out of the question. I tried the big, new PSU and it didn’t change anything. So much for that!
  • Memtest, came out okay.
  • Reinstalling (Maybe I missed a config that’s ruining it). This time to bare Archlinux. I cherry picked everything on there now, but nope…
  • Playing with LACT to keep the frequency at the highest on the GPU. This helps somewhat, but it just delays the issue. It also causes me to not have to reboot entirely, and even the DE recovers completely, usually.

The logs

This one is with some of the newer, bleeding edge packages, it’s how most of these went down. Game froze, then held that way (while music and audio continued to play as normal). Then blackscreen, unable to switch TTY while this went on. I recorded this thru SSH… [ 0.000000] Linux version 6.17.9-arch1-1 (linux@archlinux) (gcc (GCC) 15.2.1 - Pastebin.com Sometimes it would get unstable so even if I do get it to recover, it would have mouse stuttering every few seconds. So it’s usually a reboot. SysRq, REISUB, which it DID listen to!

Then the most recent one [ 0.000000] Linux version 6.17.9-arch1-1 (linux@archlinux) (gcc (GCC) 15.2.1 - Pastebin.com , in this one, it actually recovered by itself, which just killed the game but the rest kept on living.


I’m sorry for the long-ass post, I just wanted to show you that I’ve tried everything I could so far. Another thing I’m gonna try is to just switch to Plasma which is the most developed Wayland compositor and desktop, and also where Valve has their eyes on. I also considered using a gamescope-steam session to get the compositor completely out of the picture.

1 Like

This might be related to an issue with the latest AMD firmware in Arch Linux.

The Arch Linux firmware “linux-firmware-amdgpu 20251125-1” contains the firmware file(s) that might cause the issue. Rolling back to “linux-firmware-amdgpu 20251111-1” might fix it.

I can also see this issue on my desktop board 128 GB custom build if I use ROCm. I don’t see this issue when I use llama.cpp with Vulkan. I also don’t see any issue during normal non GPU workloads (e.g. internet browsing). So I didn’t rollback the “linux-firmware-amdgpu“ package on my system.

I also don’t use any of your kernel options.

Does this setting help at all with the crashing?

This one doesn’t help, I actually tried it as well, but forgot to edit it in!

Okay, so I actually started out on 20251111-1 and had the same issue. But this is a good idea, I might actually go even farther back on that firmware to see if it does anything. Maybe that one’s the reason it worked in the very beginning when I just got the desktop. I switched to linux-firmware-amdgpu-20251021 to see.

EDIT: The older firmware still crashes

In the meantime, I found a third game that crashes. Final Fantasy VII rebirth. But not during regular gameplay segments, only specifically during the minigame “Queen’s Blood”. Since there, it exhibits the same sort of “frequent, regular fps dropping” that the other two games have. And of course, within seconds, it freezes too, gpu driver crashing the exact same way.

Otherwise, I can play the game for 8 hours without any crashes. But starting Queen’s Blood, it happens literally in seconds.

So now I have 3 games (across different engines) exhibiting the same pattern due to some erroneous behaviour of the game itself. But since it’s 3 games doing it, I don’t think with this pattern it can still really be blamed on the games either…

Hi,

I just posted this in the Framework 16 / Linux section (no idea how to crosspost this to 13 and Desktop, because it applies to these aswell):

TL;DR: Some changes in the amdgpu driver included with kernel 6.18 seem to be broken to the point it leads to crashes and reboots on newer (RDNA 3/4) AMD GPUs. Also just noted that it very likely applies to older kernels with a backported driver aswell.

Same MES/ring timeout class on Strix Halo HX 370 + OCuLink + RX 9070 XT

Hitting the same structural cascade you describe (MES non-response → GFX
ring timeout → ring reset reported as success but rings stay wedged) on a
different but related hardware combo: GPD Win 4 (Ryzen AI 9 HX 370 /
Strix Halo) + Minisforum DEG1 OCuLink dock + Sapphire RX 9070 XT (Navi 48
/ RDNA4 / gc_12_0_0_uni_mes.bin firmware 0x8b).

Sharing here because (a) it’s the same Strix Halo APU as Framework Desktop
on the host side, (b) it’s the same RDNA4 GFX/MES code path as your
crashes, and (c) every workaround you reported tested-and-failed is also
ineffective on my end — strongly suggesting one shared root cause rather
than two coincidental bugs.

I’ve filed three upstream issues (cross-linked here so you can pile on if
useful):

  • freedesktop drm/amd #5294 — ring gfx_0.0.0 timeout on idle wake
    from DS_GFXCLK (Navi 48 specific, not RDNA2/3)
  • freedesktop drm/amd #5274 — MES v12 firmware null pointer
    dereference (regCP_MES_INSTR_PNTR = 0x705c on fw 0x89, 0x72c4 on
    fw 0x8b)
  • kernel.org bugzilla #221540 — PCIe D3cold bus loss on OCuLink
    eGPU chain

The OCuLink piece is specific to my setup, but the GFX ring / MES bugs
reproduce without OCuLink involvement — they fire on internal GPU work
(kwin_wayland compositor flips, Steam UI rendering) when the rest of the
chain is power-managed off. Today (2026-06-27) I hit two crashes within
3 hours on stock Bazzite 44.20260608 (kernel 7.0.9-ogc3):

  • Crash 1: GPU went to deep idle (SCLK 0 MHz / MCLK 96 MHz) for ~6 min,
    Steam updater triggered ~46 s of sustained 1300–1770 MHz work, then
    ring gfx_0.0.0 timeout signaled=40288 emitted=40290, kwin_wayland as
    submitter, ring reset “succeeded” but SDMA Fence fallback fires forever.
  • Crash 2: Steam launch from scratch, <1 min in, same cascade (Fence
    fallback storm on sdma0+sdma1+gfx_0.0.0 simultaneously). Initial ring
    timeout printk lost to handle_bus_lock: 42282 callbacks suppressed
    storm from CHTTPClientThread bus_lock traps.

Workarounds currently keeping the system semi-stable (all in use):

  • amdgpu.runpm=0 kernel cmdline — disables runtime PM entirely (otherwise
    BACO bus-loss hits within ~22 min)
  • udev rule forcing d3cold_allowed=0 on the eGPU PCIe chain (kernel.org
    bugzilla #221540 / Mario Limonciello’s v2 patches that haven’t been
    upstreamed)
  • KWIN_DRM_NO_DIRECT_SCANOUT=1 plasma env

Tried-and-ineffective on my end (same as your list):
amdgpu.ppfeaturemask=*, amdgpu.mes=0/1, amdgpu.pm=0,
amdgpu.gfxoff=0, force_performance_level=high, ppfeaturemask writes,
pp_features writes, firmware downgrade attempts. PMFW on Navi 48
appears to ignore every userspace and kernel-level power management
request that targets DS_GFXCLK / GFXOFF.

One driver-side patch I built and tested on a custom 6.19 kernel does
appear to help the idle-wake variant: adding
amdgpu_gfx_off_ctrl(false) in gfx_v12_0_ring_begin_use and
sdma_v7_0_ring_begin_use, mirroring what sdma_v5_2 already does for
the analogous SDMA 5.2.3 bug. On a 4-minute focused window it produced
6 clean wake transitions from deep idle (twice literally from SCLK 0 MHz),
zero timeouts. Posted as a comment on #5294 — feel free to grab the
patches if you want to try them on Strix Halo native. They do NOT fix the
sustained-workload hang (Cause #5274 family) though.

Three reproductions in one day, two candidate workarounds eliminated

Today (2026-06-27) I caught the same hang three times in a 5-hour window
on stock Bazzite 44.20260608 / kernel 7.0.9-ogc3.2 — identical signature
every time:

Time Trigger Time-to-crash GFX seq at hang
11:10 Steam updater in background, no game ~8 min signaled 40288 / emitted 40290
13:31 Steam launch from cold, no game ~1 min (printk lost in bus_lock storm)
14:30 Steam launch with two candidate workarounds active ~3 min signaled 42747 / emitted 42749

All three: kwin_wayland as the submitter, exactly 2 commands pending
at the timeout, sustained 1300–1770 MHz GFX work for tens of seconds
before the hang, identical cascade (ring reset reports success, SDMA
Fence fallback fires forever, CRTC flip_done times out, displays freeze).

The two candidate workarounds I tried between crashes 2 and 3 are ones
that have fixed adjacent RDNA4 bugs on standard desktop installs:

  • RADV_DEBUG=nocompute (fixed RX 9070 XT desktop game-launch crash
    on Arch BBS #311628, kernel 6.18.5) — ineffective here
  • KWIN_DRM_NO_AMS=1 (fixed RX 9070 XT kwin flickering on amd-gfx
    msg121800, Plasma 6.4) — ineffective here

Useful as elimination if anyone here wants to skip retesting them: the bug
is not in Mesa’s Vulkan compute path and not in the kwin atomic-
modesetting path
. It’s in the GFX ring submission path that kwin uses
for ordinary compositor work, under sustained non-compute GFX load.

Steam’s CHTTPClientThread also triggers a massive split-lock storm
(handle_bus_lock: 42282 callbacks suppressed in 5 s) which has the
side effect of swallowing the kernel ring-timeout printk — only the
downstream Fence fallback cascade survives in the journal. Worth knowing
if anyone here sees a Fence fallback storm with no preceding ring timeout.

Happy to share devcoredump bundles, kernel logs, sclk-monitor traces, or
ACPI dumps — let me know what would be most useful to triangulate.

My guess towards diagnosing these bugs is to somehow get a crash dump from the gpu side.
My guess is:

  1. gpu crashes
  2. request queue stops being processed
  3. os sees timeout of requests.

No one at amd has been able to tell me how to obtain the gpu side of the crash. One is only ever able to get the stack trace from the os side, never a stack trace or similar from the gpu side.

For example, if the gpu fails to read from a memory location, there is no way to report that detail. If we had details, such as failed at location X in gpu firmware blob Y. It would be much easier to fix.

Yes, this was my first thought. Rather than relying on this or that game, I wonder if there is a GPU demo/test system that runs through all possible GPU capabilities. That might be a bit more verbose about the specific call/operation that causes this.

I’d also suggest running memtest86 and seeing if there are any RAM errors.

I think our new machine is having this issue although I’m not sure enough to file a support ticket yet. Running latest Bazzite-Deck image, and latest bios (3.06). Pulled these logs via Cockpit but have not looked to closely to see what they mean.

Ivy