@nrp I did contact support and they put in a order for me for new thermal paste. However, it has been a week or so and it hasn’t shipped out, so I ended up buying some GELID GC-EXTREME thermal compound and made sure to coat the CPU/die completely. It did definitely lower the temperatures, maybe on average 15-20°C but it is still overheating and now even throttling to 199 MHz. This happens very regularly throughout the day when I am using it.
What can I do? It makes my entire workflow screeches to a halt while it cools off.
Forgive me if I am repeating something that was already suggested.
Most of the threads I have seen referring to running at these reduced clock speeds are caused by an issue where the foil cover for one of the expansion bays is contacting something it shouldn’t and causing a short that shouldn’t exist, and the throttling down of the system is a self-protection method.
Hi @Jordan sorry about the delay. We are just getting the thermal paste through our inventory process for shipping. With the updated thermal paste you applied, are you seeing temperatures hit 100C? If not, it’s possible the throttling is being caused by something intermittent that is separate from the original thermal paste issue or thermals generally.
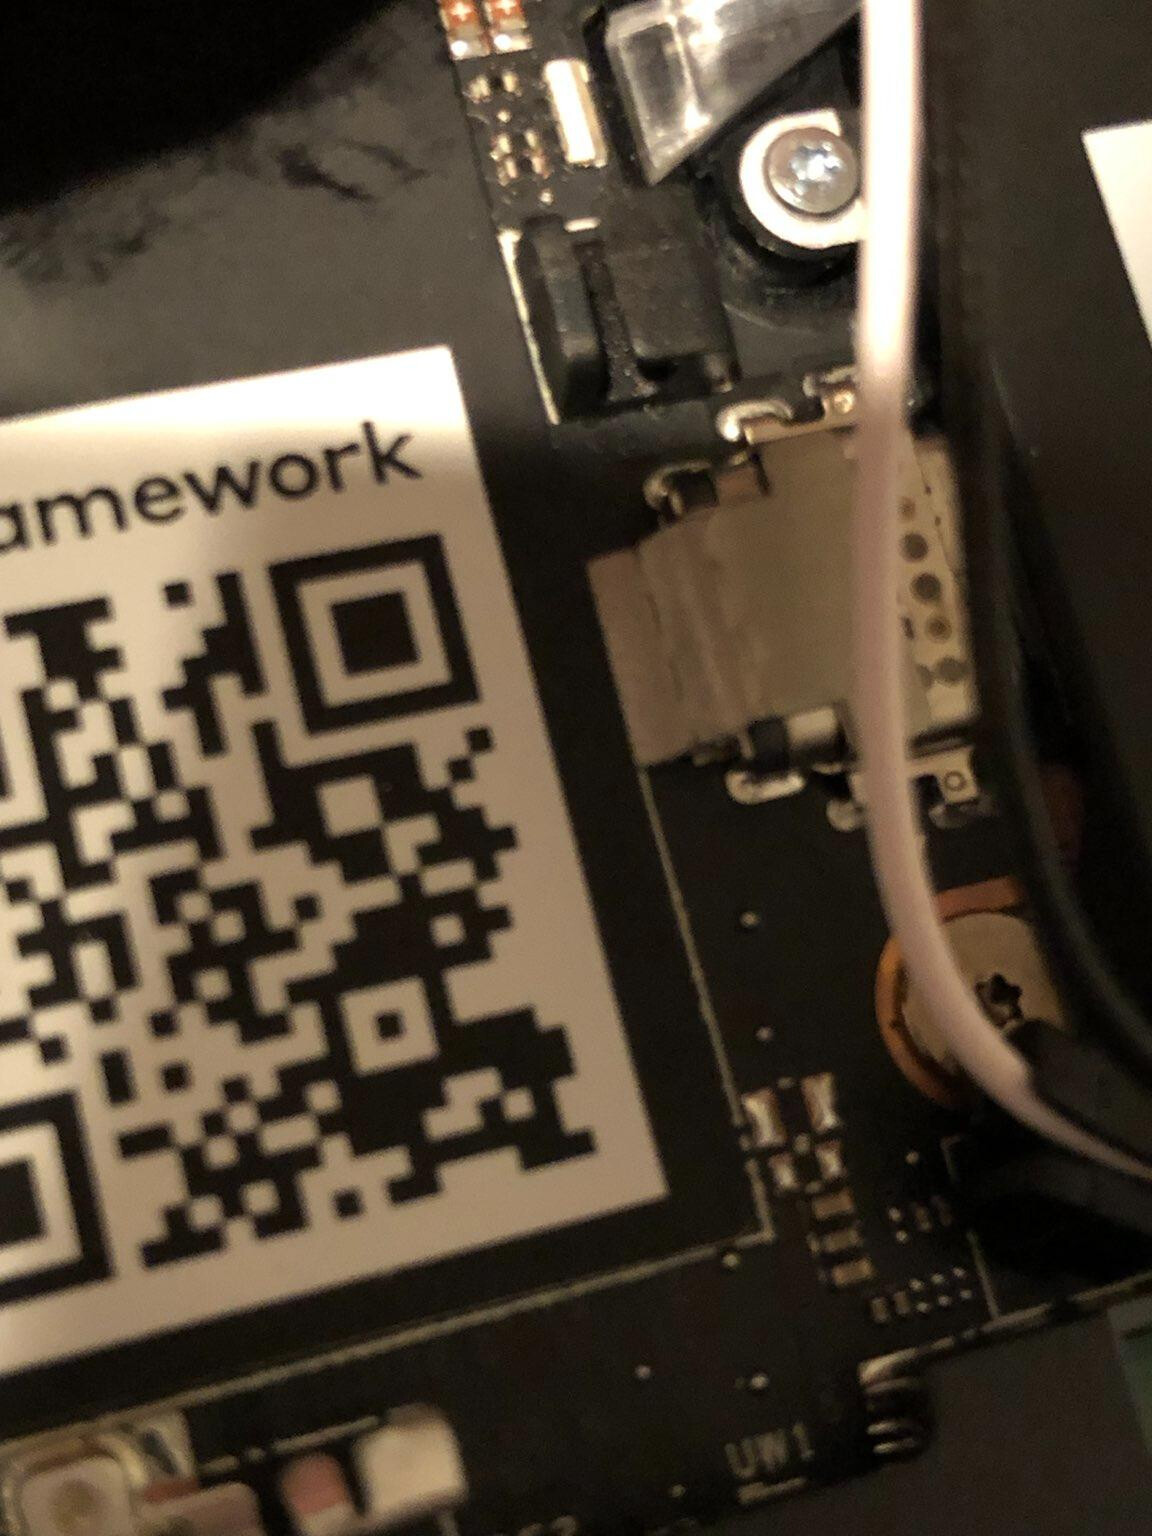
@Jordan We don’t suggest adjusting the EMI stickers unless the port has a functional problem such as expansion cards not recognized or not charging. You can continue to use your system without the sticker and there should not be any difference in performance. If you want to, you can just place some tape over the top of the sticker to hold it together and reapply it.
@Adam_Hupp
Since you have a consistent repro case could you try downloading and installing the intel power gadget
And then running the following command:
“C:\Program Files\Intel\Power Gadget 3.6\PowerLog3.0.exe” -resolution 100 -duration 600 -file cpulog.csv
Which will log your cpu speed, temperatures, and throttling for about 10 minutes.
If you can start this as soon as the system boots, and capture a log of the system performing normally and then transitioning to the low frequency state it would be helpful for us.
If you can share the csv with us we can take a look and see if we can find the source of your throttling.
@Kieran_Levin it was reproducible for a day or two, the stopped. Possibly because I’m not using the pass-through power on my janky USB hub anymore. I installed that tool and will grab a log if it starts happening again.
So, I’ve noticed a slight cpu clock issue with mine. Occasionally, it’ll decide to run at .39 GHz while under load for 15-20 seconds, before slowly getting back up to normal speeds. I’m fairly sure it isn’t temp related as the cpu has run for extensive periods at 100% usage around 3.5 GHz and not had any issues, but, (as my most recent example) I was running around 25-30% utilization when it decided to clock down to .39 GHz for the aforementioned 15-20 seconds before speeding up again.
Is there anyway to find out what’s happening (like running some sort of terminal while I’m using the laptop to see if it throws an error code?). Additionally, and this could be the cause, I was running it with an egpu at the time. (should I follow the advice from this previous post?) ↓
Darn, It happened when I had the power gadget running, but not when I had it logging anything. I’ll try to get the log next time but I do have a screen shot of the power gadget’s graphs that cover the period of it dropping to .39 GHz and just when it started to recover.
@DannyT Yes I am, a 2060 Super. Its worked pretty well so far (with a little tweaking and disregarding this occasional issue (if it is caused by this) )
I’d also like to add to my findings, I just ran a benchmark to add some stress to the cpu and see if I could replicate it while logging, and it didn’t drop down to .39 GHz. Although, would there be any reason why the cpu would run hotter when connected to an eGPU rather than not?
I managed to start the log while the computer was at .39Ghz. Actually, it was stuck at .2Ghz this time and a restart was required to fix it.
As I was typing this it happened again, but fixed itself from .39Ghz
Here is a google drive link to a folder of the log of the intel power Gadget, both times started after the issue began (sorry I couldn’t capture before hand)
My clock has gotten stuck at 200MHz a few times on Ubuntu 21.04. A reboot has fixed the issue each time, but powertop shows all cores at 199 or 200MHz. I don’t have many other details yet since I just got the laptop today.
When the clock is throttled the Intel Power Gadget shows “PROC HOT”, but the “package temp” is only 46c.
ThrottleStop reports “BD PROCHOT”:
This thread suggests that “BD PROCHOT” is from an off-cpu sensor that can signal heat problems from other areas of the laptop. Which explains why this is happening even though the reported package temp is fine.
Just from watching the “BD PROCHOT” indicator, it seems like the throttling only really kicks in when the GPU is reporting it. It’s weird to me that my GPU utilization is at 88+% even when I’m just sitting here in Chrome.
Thanks for the log! Note that the GPU utilization is likely expected, in that the GPU clock frequency is generally running quite low when idling or at desktop. For example, I’m sitting in Chrome with the GPU at ~200 MHz while the CPU is at 4 GHz.
@Adam_Hupp
When the laptop is in this state, does it show that it is charging from the adapter? Also what is the side LED on that side of the laptop showing?
Also if you move the charger to a different port on the same side does the clock still drop to a slow speed?
Electrically prochot is designed to throttle the CPU to minimum speed when the system is too hot, or when power events change. So this is tied to the PD controller managing each port. When a port is plugged in or unplugged it should throttle for a few milliseconds and then go back to normal. However if there is an issue with the port it may cause prochot to be low as a safety measure. One issue we have found is that the EMI sticker can sometimes cause this behavior on specific ports.
Have you tried reapplying the EMI sticker as mentioned elsewhere in the thread?
I think it still showed as charging but am not sure. Don’t know about the LED or changing to a new port; if it recurs I’ll try that. I have not done the EMI sticker fix, will do it this weekend and see if things resolve but this is infrequent enough that it will be hard to say for sure.
At what point with an issue like this will the framework team provide a RMA/part replacement? And are shipping & other related costs covered by the warranty?
Hi Cameron, we cover shipping costs and the cost of the replacement module in cases where there is a manufacturing issue on the item. In this case, we haven’t seen a consistently reproducing scenario, and so we want to continue to work with anyone who has seen it occur to find the root cause. If we determine that there is a hardware issue on someone’s mainboard or other module causing the issue, we would do a replacement within the warranty period.


 )
)
