The fact that this isn’t happening to every single laptop implies that it’s some sort of quality control. Does anybody use a different PD charger so that we can isolate the problem?
@Shawn_Lewis , it could be happening at different levels for other users and they may not have noticed it. This is happening consistently to me at exactly 83%.
I must say, the clock drop absolutely brings down the laptop’s performance to its’ knees. It takes 14 seconds to open Brave Browser and 43 seconds to load http://community.frame.work/ .
Zoom hangs, office documents stutter and the whole windows/linux experience turns into a power point.
Has any progress been made here by the dev and eng teams?
@RandomUser Thanks!
Well then I can confirm that the EMI stickers is not the fix for me. Hopefully there is some update on a fix for this because it is starting to make it hard to do a lot of things.
Does the same thing happen when the laptop is just sitting in the bios screen?
I’ve allowed the computer to sit plugged in and shut off for over 10 hours. I booted it back up and check the battery, it showed charged 100%, with 95% battery health (it went from the 93% it was at yesterday?) I rechecked CPU frequency stats in powertop and booted up the same game again, everything looks normal. I played the game for 45m to let the processor heat up and use power.
The clock speeds settled down:
iGPU stats:
and reported system power usage
![]()
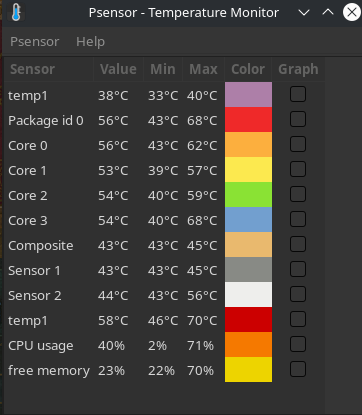
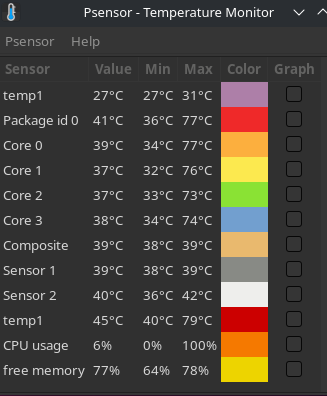
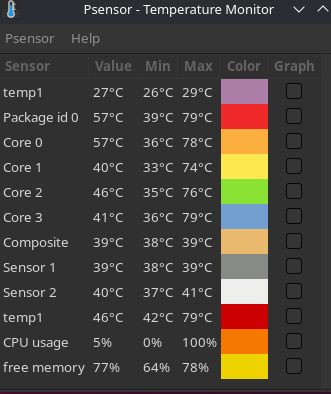
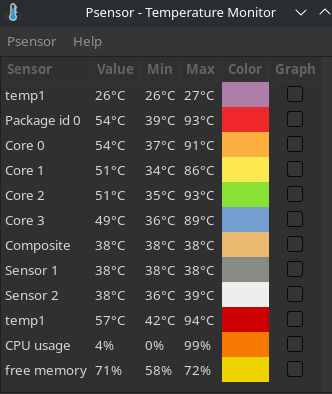
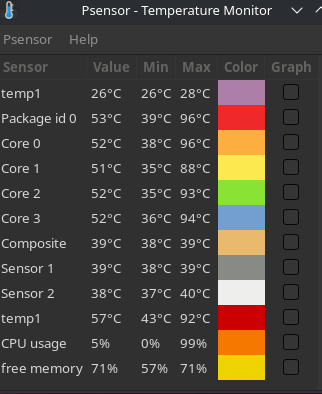
and the temperature readings (the current temp is with the game shut off and idling at desktop)
all of this looks normal.
So the problem seems to only occur when the battery is charging, and even then only when it’s at certain charge levels. I’m wondering if the battery health number is associated with the issue at all. The fact that it went back up from 93% to 95% seems to indicate that the battery is actually able to hold a higher charge than the software indicates, which could be tied into how the battery is charging (maybe an interaction with the USB-C PD?)
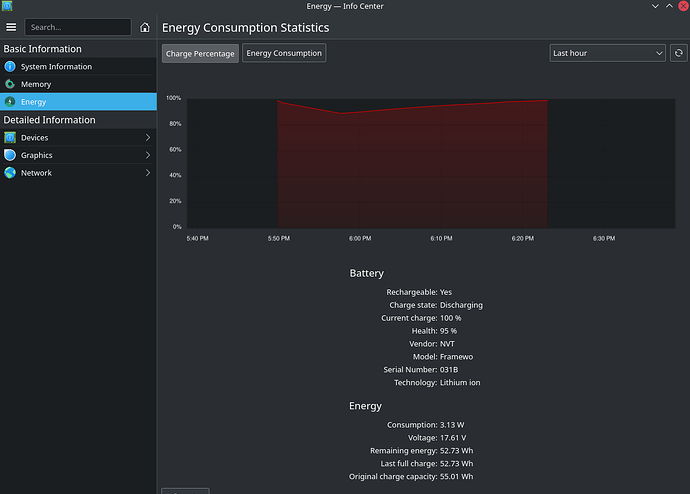
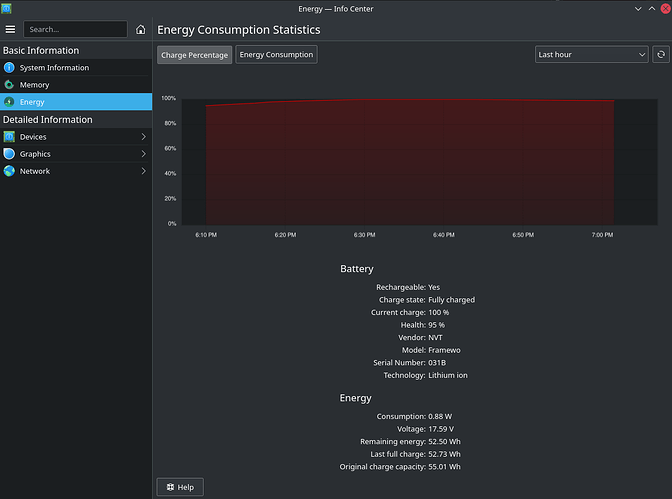
This is what the battery stats show:
I found this other issue, maybe it’s related?
I think you may be onto something. I’m going to do some more testing and get back to this, but a quick check. I uninstalled “tlp” and “tlp-rdw” from my system completely, rebooted, and the clock speeds are a bit higher on average which is to be expected since the CPU isn’t sleeping as much, but what’s more interesting is that unplugged the power, letting the battery drain a bit, then plugging it back in does not cause the sudden drop to 400MHz clock speeds. I will need to do more testing.
Edit:1
Unplugged, running on battery, clock speeds around 3.0GHz
I let the battery drain to 89%, then plugged in the power cable. The clock speeds all rose over the course of 20 seconds to 4.0GHz across all cores, then they rapidly fell off, down to 400MHz, and are slowly recovering.
I let the cpu “recover” over 30m, still running the game in the background, the CPU cores have settled on the following:
GPU utilization:
Power usage:
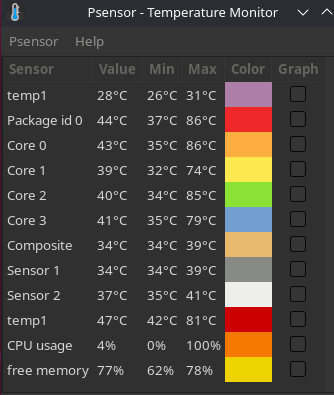
Temperature readings:
Battery stats:
Shutting off the game and re-launching it produces the same results. Going to try rebooting now.
Rebooted the computer via sudo reboot at the terminal.
Relaunched the game, idling in the same place.
CPU Utilization:
GPU:
Power usage:
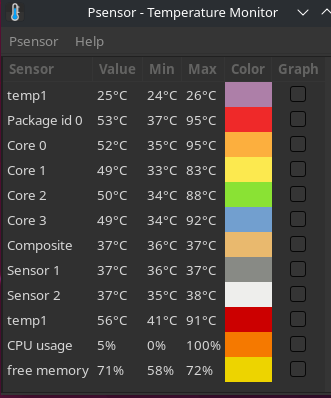
Temperature readings:
Battery stats:
It doesn’t seem like much has changed. The CPU clock speeds are climbing up a bit more. As of typing this it’s
now 2GHz on all cores except 2, which are at 1.2GHz and 1.9GHz. In-game performance has gone up from the 30FPS it was before rebooting to anywhere between 30-40FPS right now.
I’m going to let it sit idling a bit longer as is and see what happens. I wonder if the battery eventually topping off will cause a change, or if shutting the computer completely off and letting it stay off for 30 seconds or so before rebooting will change something. Will post more later.
Edit 1:
20m later battery is now registering as “fully charged” no longer any indication of discharging.
CPU stats:
GPU stats:
Power usage:

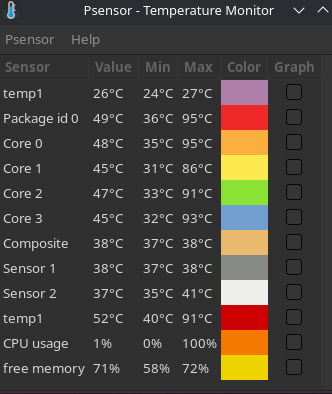
Temperature readings:
In-game performance hasn’t fully recovered back to where it was before I started this test. I’m going to try rebooting again, and if there is no change, then do a full shut down and let it sit for 1m or so before checking again.
Edit2: After rebooting via sudo reboot performance is back to normal. clock speeds and all other stats seem to match what they were before starting the test.
Some thoughts I have:
-
It’s tied to the battery charging state in some way, as soon as the battery no longer reports charging (sometimes it reports charging when it reads 100%).
-
Why are my clocks higher with the power cord unplugged? That’s very counterintuitive. There doesn’t seem to be much of a difference in game framerates either way though.
-
Is there a temperature sensor that is tied to the charging circuitry that the software isn’t able to see?
Wow, after reading through your saga, now I’m curious. Are you able to test whether this issue is isolated to Linux somehow? It definitely seems like there’s some strange interaction with the battery.
This makes sense. That’s the cooling fan you’re hearing. The system is likely configured to use it more conservatively while off the charger, since it does itself draw power. Ergo, when you unplug it, the system may raise the criteria for ramping up the fan. That being said, either way you’re not hitting a thermal limit during your game, as evidenced by your temperature readings, so I guess it doesn’t matter.
I don’t think I’m affected by this issue but I will begin testing it.
I’ve been using the computer normally since my last post, played some more games, did web browsing stuff. It hasn’t been rebooted or any other settings changed since then. Out of curiosity for why my clocks while plugged in weren’t reaching that high, I decided to run a benchmark to stress the CPU more and see how high the clocks go. These are my results:
While the benchmark was running, I was monitoring the clocks using a different tool instead of powertop, because powertop doesn’t update the frequency measuring very often and it only records the average clock speed over time. I used i7z CPU frequency scaling - ArchWiki and watched the clocks as the test was running. The cores were able to scale all the way up to the 4.7GHz for brief bursts on a single core as expected, with the 4 core multicore freqs peaking around the expected 4.1GHz for brief bursts. I’m curious to run this test again when it’s only on battery and see if my results change.
I could test using a windows trial version, but I’d need to get a separate boot drive as I don’t want to mess with my primary OS drive which is partitioned only for one OS at the moment. If someone else who is a windows user can try and reproduce the results I’m seeing here on their windows install that would be helpful.
I have a Batch 3 laptop, using the 1165g7 CPU.
I installed Windows 11, and then Cinebench r23 through the Windows store. At first I thought I had something, but it must have been due to outside influence. However, if this issue only occurs at specific charge levels (ie in a range from 65-90% or something similar) then my tests wouldn’t have showcased the issue properly. My laptop scores 5150-5180 points on this test, using the default 10 minute minimum benchmark time, and seems to maybe lose a few points plugged in, but it isn’t significant.
Next I’ll have to use 3Dmark tests and see if this issue only occurs with both the CPU and GPU under heavy load, since they share power and thermal budgets and one can thus limit the power of the other.
I ran geekbench under 3 conditions as a test:
I start with a freshly rebooted computer, no extra programs running in the background except
- i7z to monitor cpu freqs
- htop to monitor cpu usage across all cores
- psensor to monitor CPU and system temperatures
- geekbench5 the test program
Condition 1: Fully charged battery, plugged in, battery not showing as charging.
Trial 1: Framework Laptop - Geekbench
Trial 2: Framework Laptop - Geekbench
Trial 3: https://browser.geekbench.com/v5/cpu/10403614
Condition 2: Unplugged, started just after running the test from above, so 100% charge and not charging
Trial 1: https://browser.geekbench.com/v5/cpu/10403660
Trial 2: https://browser.geekbench.com/v5/cpu/10403710
Trial 3: https://browser.geekbench.com/v5/cpu/10403753
Condition 3: Plugged back in, after running the test above. Starting battery level was 95%
Trial 1: https://browser.geekbench.com/v5/cpu/10403872 96% charge
Trial 2: https://browser.geekbench.com/v5/cpu/10403903 98% charge
Trial 3: https://browser.geekbench.com/v5/cpu/10403935 99% charge
The results are very interesting. The best performer was unplugged, on battery, the second best was plugged in, fully charged battery, and the worst performer was plugged in, charging battery.
Some other observations:
- When I was running the test unplugged, starting from a full charge, I noticed in i7z that the frequencies were most consistently high, and on all cores simultaneously.
- I did not utilize the iGPU at all during these tests, though I imagine it would siphon off power from the CPU which may cause the CPU to downclock further.
I’m going to test ones more when the battery is showing “100% charged” but still “recharging,” and then again right after it no longer shows that it’s recharging. If I don’t see anything interesting, I won’t post the results unless someone asks me to because I’ve spammed this thread enough with data. I have a feeling that the results are going to be the same as the first set of test conditions posted above.
The trend seems pretty clear, charging the battery is taking away power from the CPU to do tasks. I don’t know if this is an issue with the firmware on the laptop, or with how my OS is configured. If someone with windows can chime in and post their results.
Edit:
Trial 4: 100% charged, battery reports “plugged in, still discharging” despite not going down in charge.
https://browser.geekbench.com/v5/cpu/10403520
If anyone wants any detailed system configuration info i’d be more than happy to provide it if asked, and you tell me what you need and how to get it.
Edit:
Reading up more about CPU frequency governors on the arch wiki, I came across this:
https://wiki.archlinux.org/title/CPU_frequency_scaling#BIOS_frequency_limitation
specifically referring to BIOS Frequency Limitation. Perhaps the BIOS is telling the OS to limit the frequency when this down-clocking issue is occurring?
MAJOR DISCOVERY
This post gave me the idea:
I switched the power supply out. I was using the framework power supply and I swapped it for a
RavPower PD Pioneer 90W Model RP-PC128
which supports the following PD modes:
5V3A, 9V3A, 12V3A, 15V3A, 20V4.5A, 90W Max
and my performance issues are all gone!
Here are the results: Plugged in, starting with 100% power
Trial 1: https://browser.geekbench.com/v5/cpu/10405614
Thermals:
Trial 2: https://browser.geekbench.com/v5/cpu/10405682
Trial 3: https://browser.geekbench.com/v5/cpu/10405729
Trial 4: https://browser.geekbench.com/v5/cpu/10405775
Trial 5: https://browser.geekbench.com/v5/cpu/10405826
I ran 5 trials just to be completely sure there was no fluke. You can see the scores went up significantly compared to all other tests I’ve run.
Some thoughts:
- My performance numbers may go down when the laptop needs to charge as I’m using it.
- My framework power adapter may be defective? Or perhaps it has something to do with how it negotiates what PD spec to use, which could be an issue with the adapter, or on the laptop side. I know its not the USB-C cable that plugs into either end because I used the same one with both adapters.
- I also noticed that all of the cores were able to sustain their max 4.1GHz boosts during the multicore tests much better than before (pretty much 90-100% uptime), which explains the increased thermals, and the significant difference in multicore scores, and maybe why the single core scores weren’t affected that much comparing the two plugged in tests when the battery is fully charged.
- The reason the unplugged battery scores were so much better than the plugged in scores is because the battery is able to deliver the required power, whereas the power adapter couldn’t supply it.
- Maybe there is a short somewhere and the additional power that this adapter puts out was able to overcome it? This could be a problem, though I would expect that much power would produce a hot spot that’s very obvious on the board.
- My battery health is reporting that it’s at 98% again.
In closing, this could be an issue for people who are using under-powered power adapters, I’m very curious to see what power adapters the other people reporting the problem are using.
Can someone from the framework team test this and confirm? Also, what PD specs does the laptop itself support for charging?
I figured it might have been power interference. Did you try isolating the problem further? Try changing the outlet in the building that you are using or if you can, a better type-c cable.
I just ran the same test again using a different power outlet, both adapters. Same results.
I don’t think this is related to the specific adapter, please note that a LOT of threads have been merged into one and there is a lot of reading to be done.
This is NOT isolated just to linux, this happens on all platforms reported so far, thus both Windows and Linux.
@nrp (Nirav), does it make sense to create a summary for this thread as the first post, or possibly pin it as a ‘known issue’ that is being investigated? Judging by the large amount of posts from different users, this appears to be a broader problem than we originally expected.
Please let us know what can we do to help you guys (and gals) to track down the issue and if needed, test out any alpha, beta or RC updates (BIOS, Drivers, etc.).
Thanks!
I keep wondering why it only happens at certain battery charge levels.
Earlier when I plugged in the power adapter at 51% charge, there wasn’t any issues.
Maybe it has to do with what specific power levels the charger charges at? Maybe there’s some kind of PD level switch over that takes place at certain battery charge levels, and if, for example, the adapter delivering 9V3A (27W) isn’t enough to both charge the battery and run the computer at a high performance level, (yet the energy demand isn’t high enough yet to switch over to 15V3A (45W), but 12V3A (36W) that my other power adapter delivers (does the framework adapter support that charge level?) is sufficient and is why it works? It could also be that the power adapters should be capable of delivering the necessary power, but the switchover isn’t taking place because of a bug, which could explain why clocks suddenly drop to 400mhz (super low power) because something went wrong.
You’re correct in that this needs more investigation.
Has anyone tried this?


