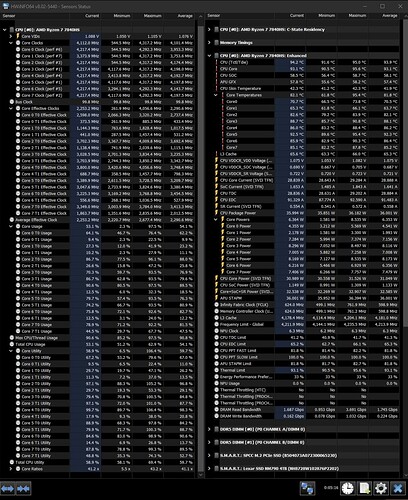
So I did a bit more testing today and got some interesting results. I don’t know how much of a difference it makes but I was using BOINC to do some thermal testing because it is always running on my desktop and if I am going to waste electricity to make heat then it might as well be useful instead of just running Cinebench over and over. BOINC is also nice because it gives you easy control over how many active threads it will run at any given time instead of just an on/off of 0% or 100% like Cinebench. I ran it with performance boost enable and disabled at marks of 25%, 50%, 75%, and 100% of core usage, letting things hit a steady state and then logging about five minutes of data. All tasks were the same being MCM through WCG and the only other open program was the monitoring program.
I am not sure about what the thread scheduler is doing but the cooler cores are quite disfavored by the system. Also, when performance boost is disabled I had the expected outcome that less CPU usage leads to lower CPU temperatures. I had the inverse with performance boost enabled with higher CPU temperatures reported on the package with less CPU usage. At 100% utilization, both with and without performance boost, I saw a sustained delta of about 13°C between the warmest and coolest cores. I saw a sustained temperature delta as high as a 18°C with performance boost disabled and as high as 42°C with performance boost enabled.
The dump of graphs is to follow.
25% Performance Boost Disabled
50% Performance Boost Disabled
75% Performance Boost Disabled
100% Performance Boost Disabled
25% Performance Boost Enabled
50% Performance Boost Enabled
75% Performance Boost Enabled
100% Performance Boost Enabled
Thank you for the new data point. Seems like on the properly functioning systems scores do check out with the NoteBookCheck review. I will try to add my new performance test results once my new mainboard ships and I can install it in my system.
Sadly, Framework RMA has been quite slow and I have to leave on a near one month vacation on June 8th so I’m praying it can arrive before I leave.
Another not as big issue popped up the same day that I received the email I was being forwarded to the RMA team. My Framework dGPU expansion bay module suddenly started coil whining when navigating the viewport in Blender.
It’s tolerable when I am in a slightly noisy environment but in a quiet environment (honestly the fans are enough to disturb the quiet after like 10 minutes), it gets pretty noticeable.
I’m not a professional on these issues so this may be incorrect, but my guess is probably that the hotter cores are also the ones that can boost more aggressively.
The thread director might be checking which cores are the fastest and assigning the loads there when threads are limited.
I agree that it is probably selecting for more performative cores and HWInfo does show the core selection ranking in its report, it just doesn’t square with me from what I have seen. I would think the coolest core under uniform load would be the most efficient. Either that or there is poor thermal transfer from some cores to the heatsink. I am also wondering if there was a thermal design tweak at some point.
In the iFixit teardown there are little bumpy bits that can be seen on the torn metal pad and on the heatsink itself. Those bumpy bits are missing from the store listing pictures for both the metal pad and the heatsink. Or maybe it is some side effect of the material repeatedly melting and solidifying.
I haven’t ran these specific benchmarks as I am on Linux, but just got in a secondary SSD so will try them on a temporary Windows install this weekend to see if I have a lower score or not. Before I only had good insight into a the overall soc temp, but that would hit 100c quickly:
http://community.frame.work/t/framework-16-thermals/
Any update on your replacement?
I am almost a week into communication with support, 20+ emails back and forth, and have reset the bios, reset the mainboard, removed all expansion cards, recorded idle temps for them, run it unplugged, ensured it was on best performance, done a RAM shuffle with six configurations of RAM, taken two videos for them, and none of this had any effect on the core to core temperature differences. Just this morning they were saying my Windows 11 tests were not actually Windows 11. I cannot think of a more trying customer service experience I have had.
Did you have to jump through all these hoops? If so are there more to come?
They did have me run multiple tests using different hardware monitors. I had to reset my bios, but other than that, it was just switching to open hardware monitor from HWiNFO.
Unfortunately since I’m currently on vacation, I have delayed my RMA request to once I return.
1 Like
my cpu is also way too hot. it idles around 80 and when playing any demanding games it shoots up too 100 very quickly and stays there even after fans ramp all the way up
It’s the Thermal design Flaw 
Take a look in the uneven cpu thermals Thread.
Most likely you Liquid Metal ran off (its an issue) as Framework has replaced it with PTM7950 in Units made after q4/24
1 Like


