Hi All,
I’ve been enjoying dialing in my FW13. I’m making this a general post as my sense is we can all benefit from comparative benchmarks independent of OS or cpu ![]()
Testing with Phoronix Test Suite (PTS) since it’s cross-platform.
Your Mission
if you choose to accept it, is to run the same benchmarks on your systems and post the resulting links below.
The first three tests to run are:
- openssl - max cpu load
- furmark - max gpu load
- Unigine Heaven - approx fps for games at a given resolution
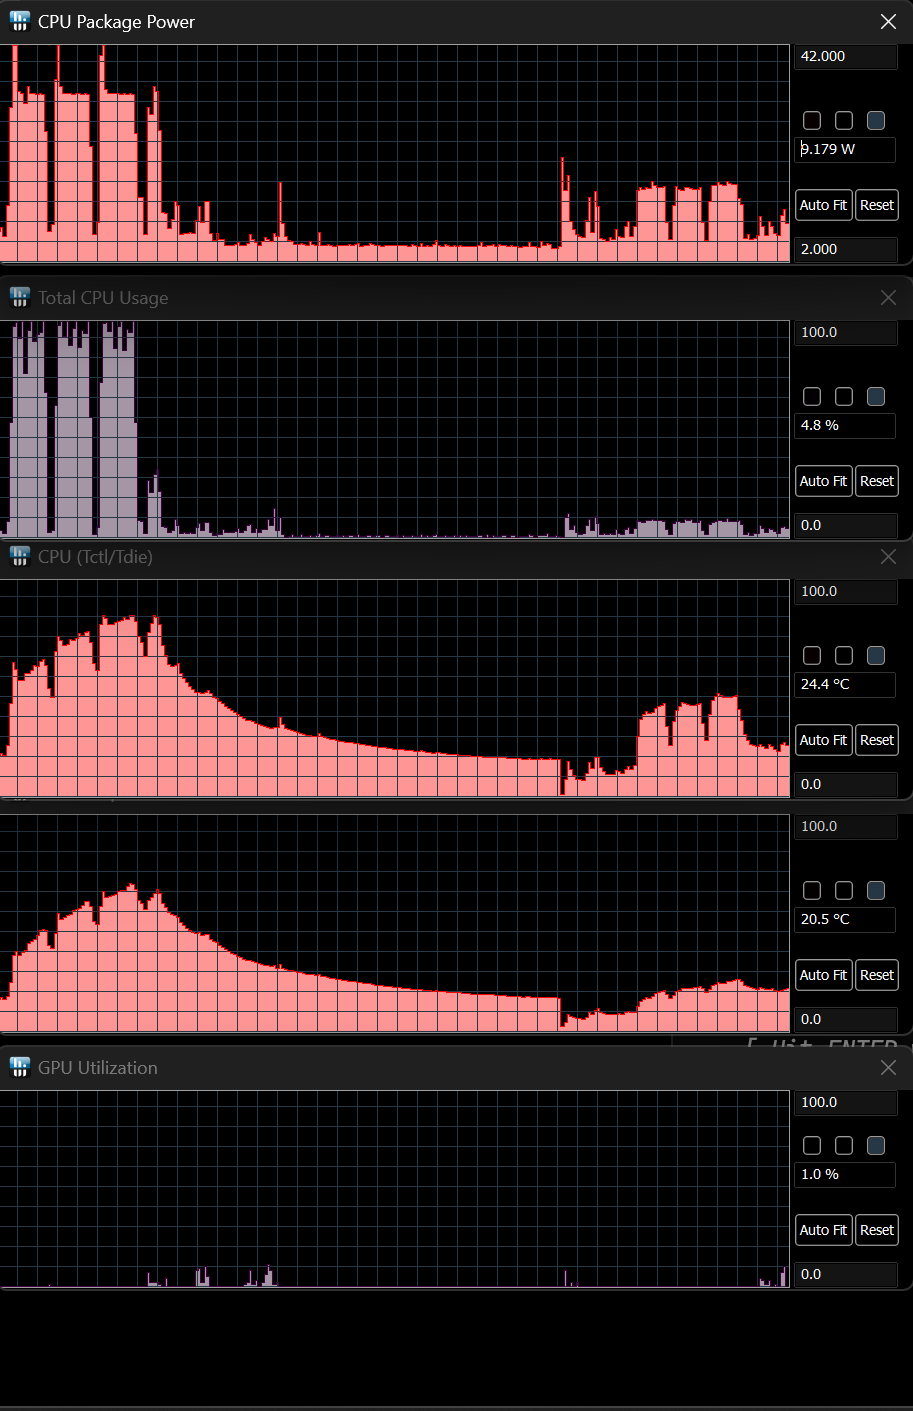
Based on JanW’s post, it’s straightforward to run comparative tests including cpu temps & power usage.
I have access to a Ryzen 5700G based desktop running the same OS/kernel and started by running these tests as a baseline.
To do the same on my FW13, on linux ensure system stats are available to std user:
sudo chmod -R a+r /sys/class/powercap/intel-rapl
Next, run each test, respectively:
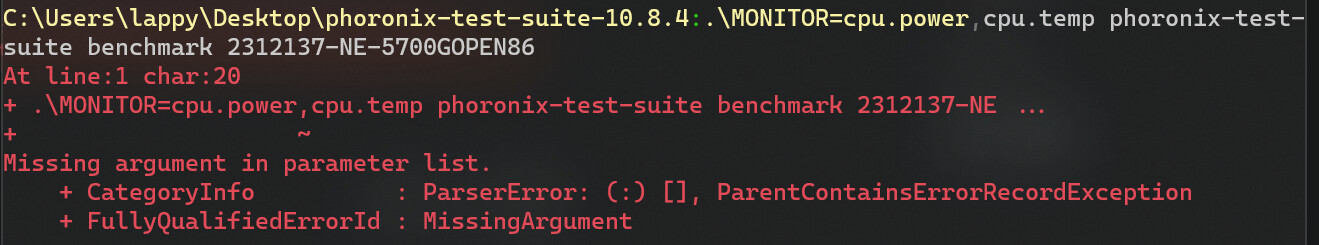
MONITOR=cpu.power,cpu.temp phoronix-test-suite benchmark 2312137-NE-5700GOPEN86
and
MONITOR=cpu.power,cpu.temp phoronix-test-suite benchmark 2312134-NE-5700GFURM44
then
MONITOR=cpu.power,cpu.temp phoronix-test-suite benchmark 2312135-NE-FW137640U42
Based on @lane_ftw’s response, here are more details for Windows users:
-
for system monitoring (also works on linux):
MONITOR=cpu.power,cpu.temp phoronix-test-suite… -
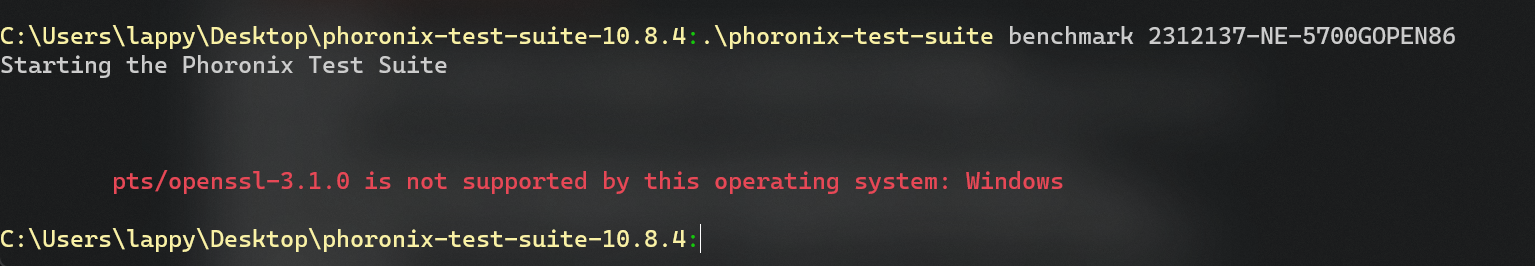
after checking to confirm the above tests were available on Win, I didn’t realize the versions have to match (my FW13 is w/o Win). Alternate way to run openssl:
MONITOR=cpu.power,cpu.temp phoronix-test-suite benchmark openssl
then choose option 1: RSA4096 -
Alternate for Furmark, in case the above doesn’t work due to version mismatch:
MONITOR=cpu.power,cpu.temp phoronix-test-suite benchmark gputest
then choose options 1: Furmark, 3: 1280 x 1024, 2: Windowed -
Alternate for Unigine Heaven, again if versions differ:
MONITOR=cpu.power,cpu.temp phoronix-test-suite benchmark gputest
then choose options 1: Furmark, 3: 1280 x 1024
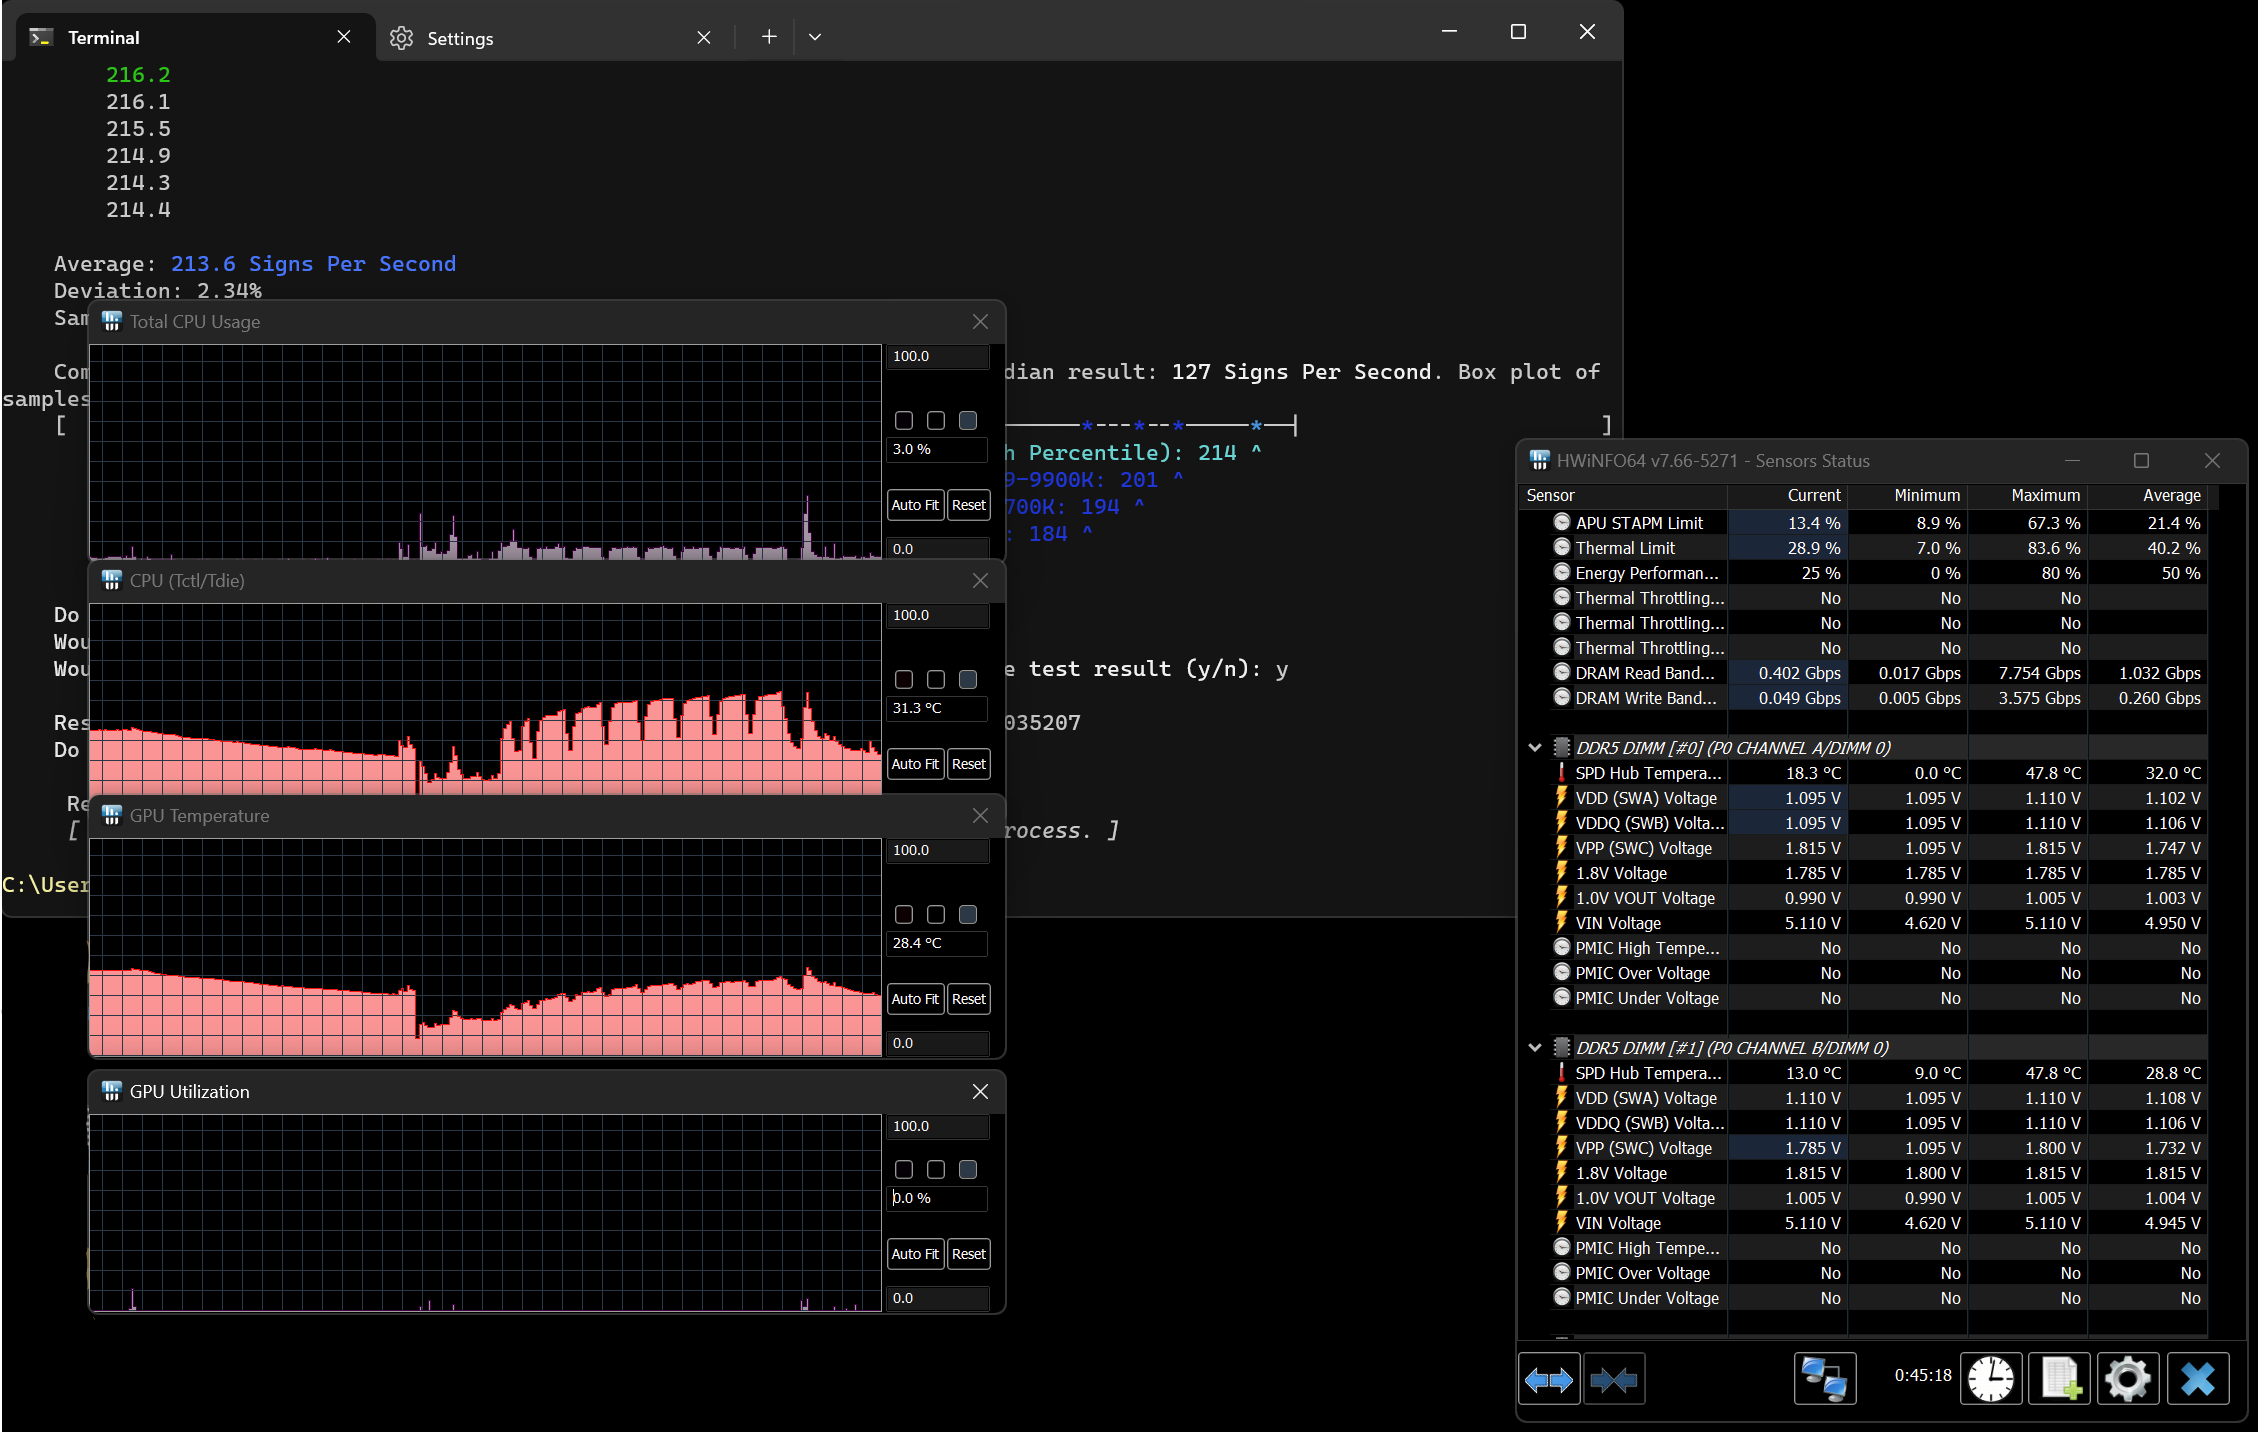
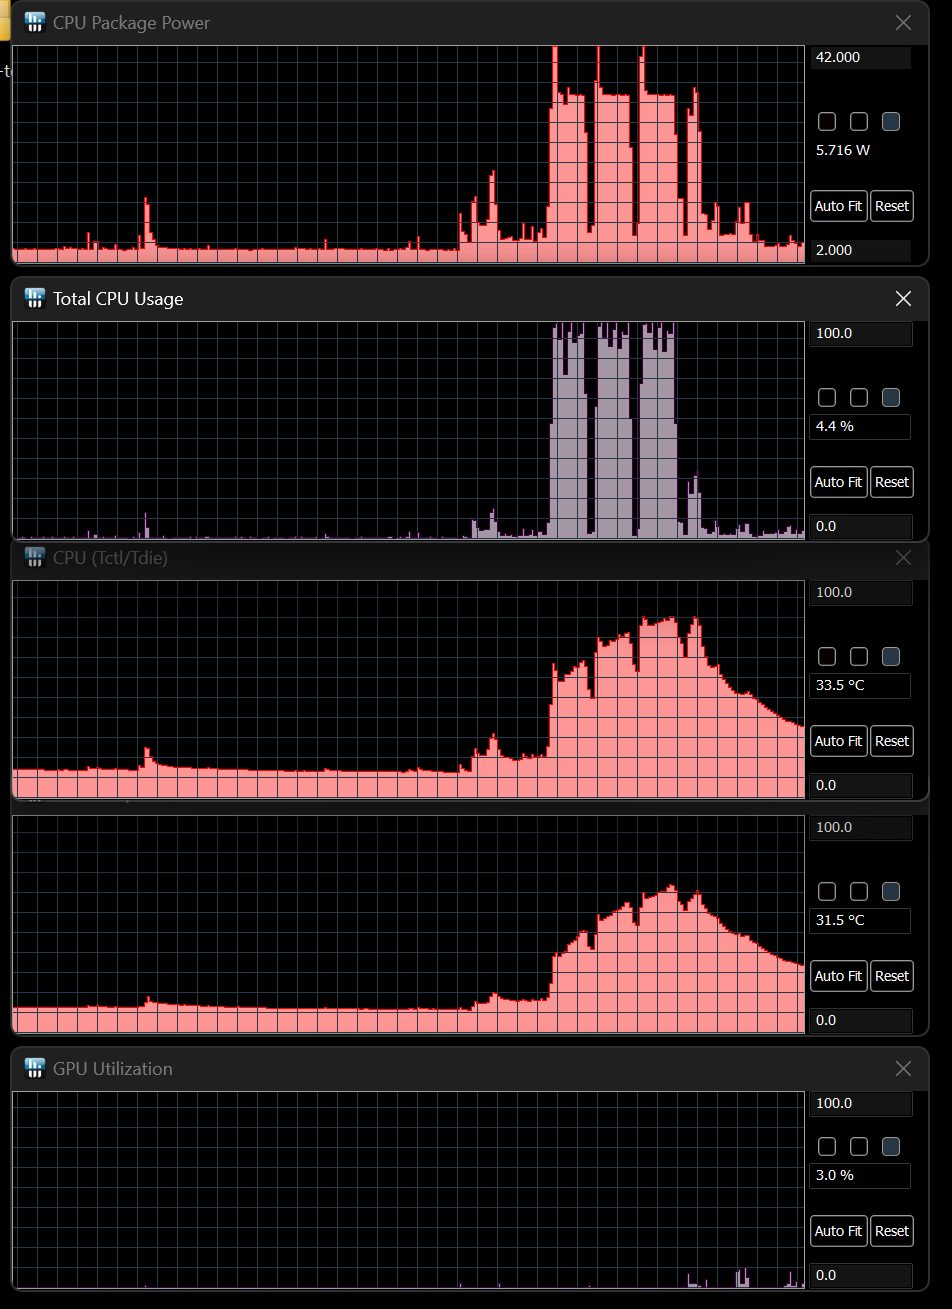
A comparison of the openssl results, first FW13 results are on battery, the second is on mains.
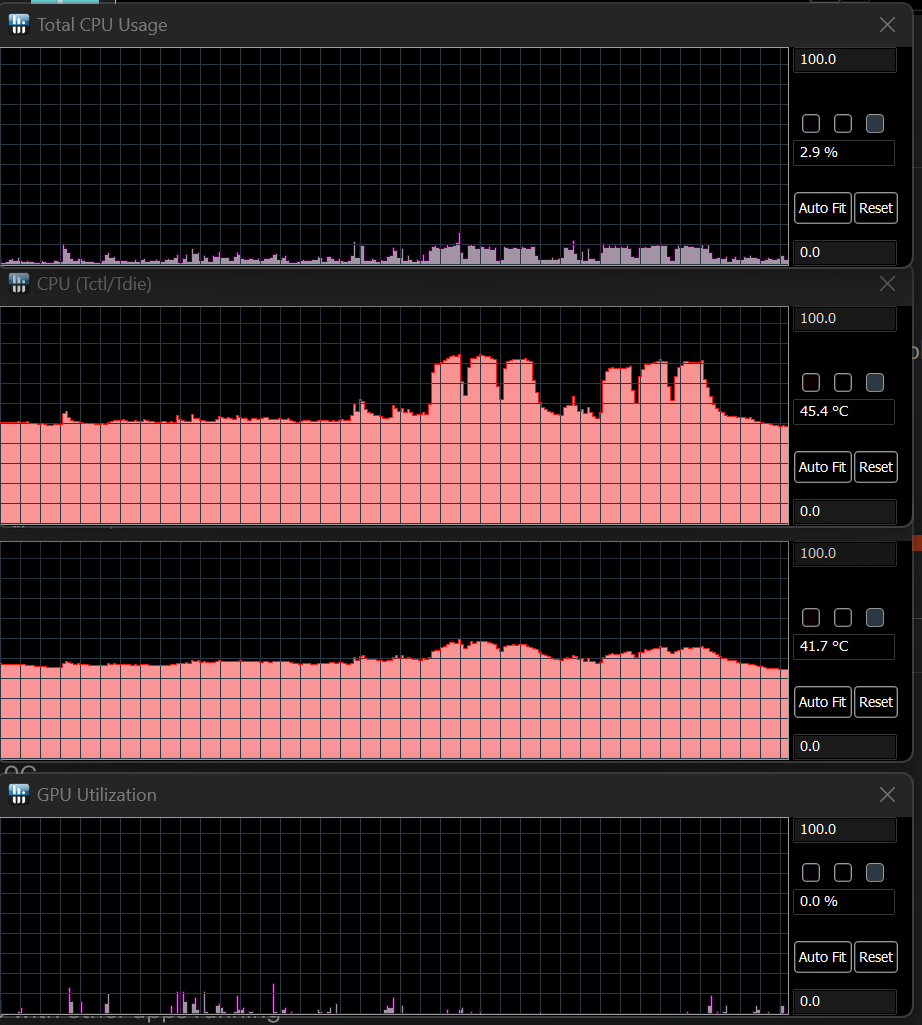
Next comparing the Furmark results.
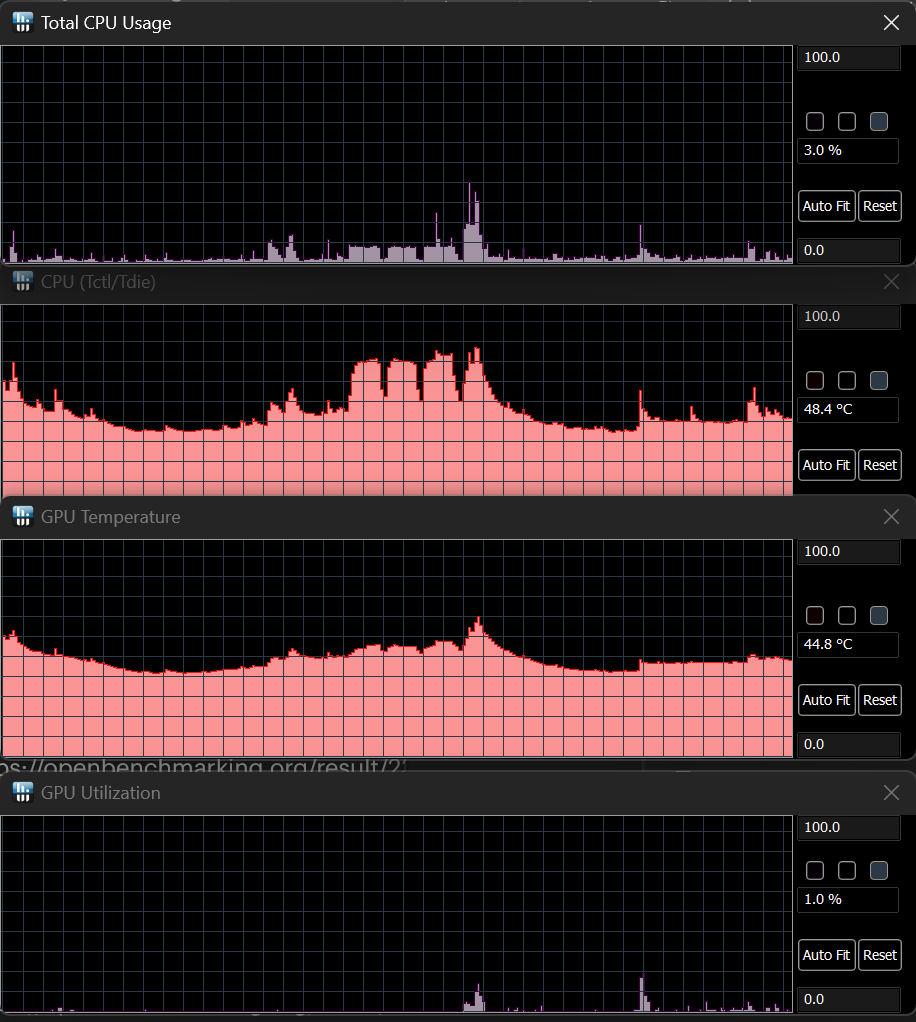
Then the difference in Unigine Heaven (solely on plugged in).
Of interest:
a) 5700G boosts to 4.6 Ghz for one thread or 4.32 Ghz for all 16 threads
b) 7640u boosts to 4.9 Ghz for one thread or 4.30 Ghz for all 12 threads (observed max 4.23 Ghz on batt)
c) 5700G shows 29-30 fps during Furmark at spec 2000 Mhz gpu clock, while
d) 7640u shows 37-38 fps at 2600 Mhz gpu clock (observed up to 2141 Mhz on batt)
e) The 760m performs nearly as well (same fps, marginally lower test result) on battery at a 21.4% lower clock
f) Unigine Heaven shows 65% higher fps for the 760m. Power draw is quite similar.
The cpu results are 79.3% more sign/sec for the Framework and 33% fewer verify/s. Power usage was 115% lower avg and 48.1% less max.
For Furmark, the 760m uses an avg 16% less W for a 29.3% higher result at 26.7% faster fps on mains and 1/2 the power for 29.1% higher result on battery!
Part of this uplift is attributable to the difference in RAM and gpu clocks:
- 5700G mem runs at 3600Mhz (so 1800Mhz gpu mem), however the gpu clocks at 2000Mhz
- 7640u mem runs at 5600Mhz (so 2800Mhz gpu mem), gpu clocks to 2600 Mhz
However it is reassuring to see measurable generational improvements from RDNA3 and such a performant cpu at relatively low power.
Sys config
CPU: 7640u
RAM: 32 GB 5600Mhz (2 x 16 GB) Crucial
OS: Ubuntu 22.04.3 LTS
Kernel: 6.5.0-1008-oem kernel
X: 1.21.1.4
WM: Xfce 4.16
GPU driver: amdgpu (OSS)
PPD, EPP power pref, scaling_gov: performance
Ambient: 21.5C
Let’s see what these laptops can do!