Thanks! The temp stays around 60-65C with limit of 100C:
| 0x0058 | 0x42C80000 |   100.000 |
| 0x005C | 0x4287452F |    67.635 |
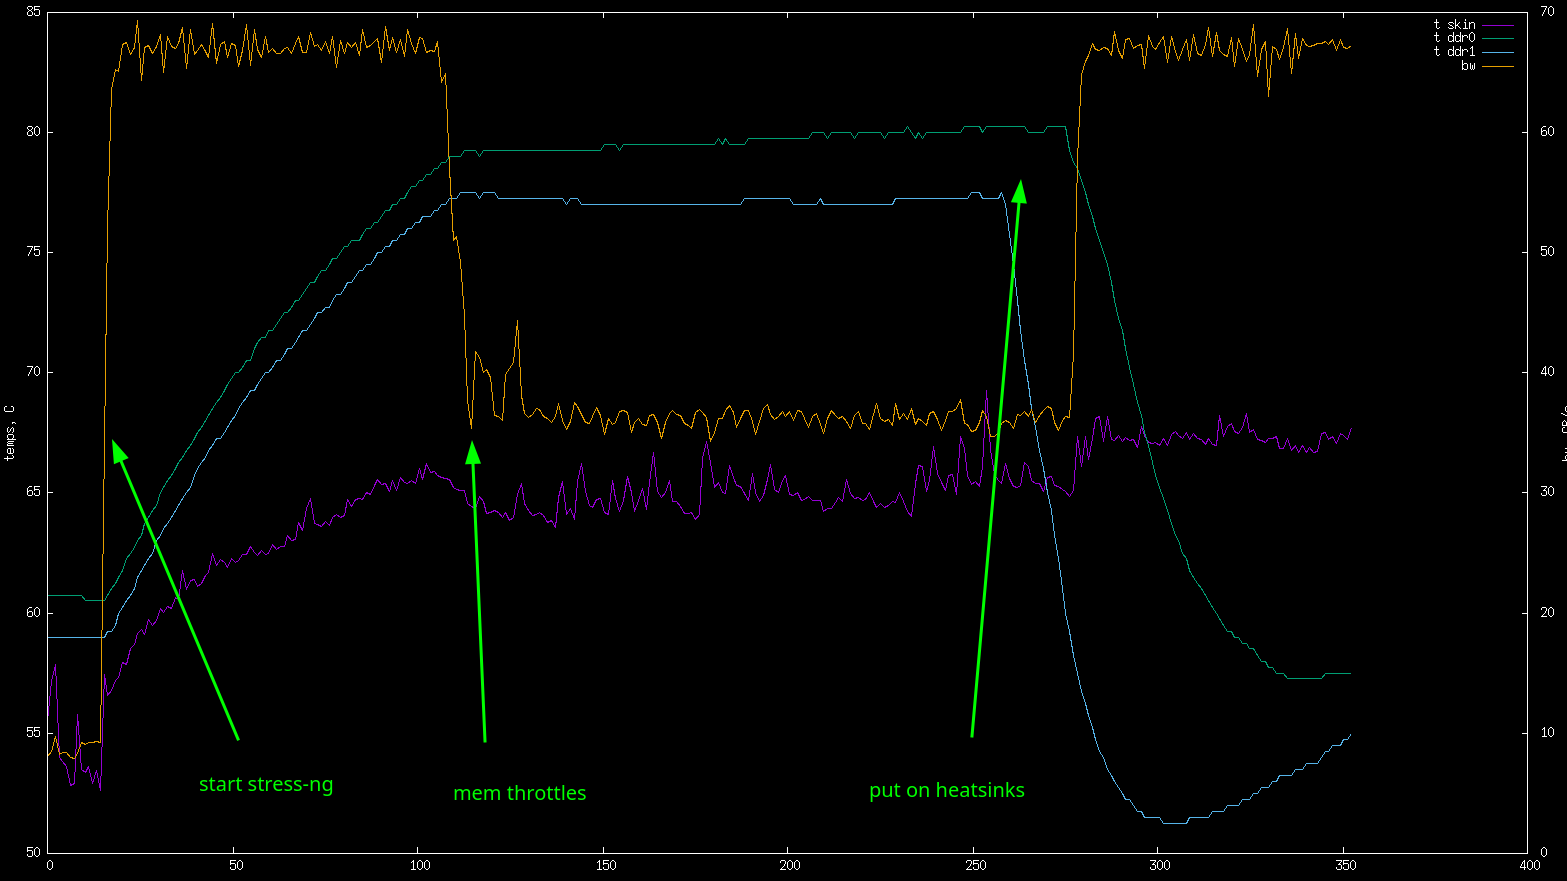
It doesn’t seem to affect throttling:
Code:
from dataclasses import dataclass
import subprocess
import struct
import time
from pathlib import Path

gpu_metrics_path = Path('/sys/bus/pci/devices/0000:c1:00.0/gpu_metrics')


def get_skin_temp():
    out = subprocess.check_output(['ryzenadj', '--dump-table'], stderr=subprocess.DEVNULL)
    for line in out.decode('utf8').splitlines():
        if line.startswith('| 0x005C |'):
            return float(line.split('|')[3])

def get_hwmon_temp(idx, fname):
    return float(Path(f'/sys/class/hwmon/hwmon{idx}/{fname}').read_text()) / 1000


@dataclass
class Buf:
    data: bytes
    ptr: int = 0

    def _read(self, n) -> bytes:
        x = self.data[self.ptr: self.ptr + n]
        self.ptr += n
        return x

    def unpack(self, fmt):
        size = struct.calcsize(fmt)
        return struct.unpack(fmt, self._read(size))


prev_throttles = None
t0 = time.monotonic()
outfile = open('metrics.txt', 'w')

while 1:
    buf = Buf(gpu_metrics_path.read_bytes())

    # see drivers/gpu/drm/amd/include/kgd_pp_interface.h
    sz, fmt_rev, content_rev = buf.unpack('<HBB')
    assert (fmt_rev, content_rev) == (3, 0)

    t_gfx, t_soc = buf.unpack('<HH')
    t_cores = buf.unpack('<16H')
    t_skin, = buf.unpack('<H')  # it's always 52.82C
    buf.unpack('<26H')
    dram_reads, dram_writes = buf.unpack('<HH')

    buf.unpack('<HHQIH4I16HHHHHH')
    buf.unpack('<8H')  # clocks
    buf.unpack('<16H')  # core clocks
    maxfreq, gfx_maxfreq = buf.unpack('<2H')  # core clocks
    # print(maxfreq, gfx_maxfreq)

    throttles = buf.unpack('<7I')
    diff_throttles = [(p - n) for p, n in zip(throttles, prev_throttles or throttles)]
    prev_throttles = throttles
    # print(diff_throttles)

    real_t_skin = get_skin_temp()

    t_ddr0 = get_hwmon_temp(10, 'temp1_input')
    t_ddr1 = get_hwmon_temp(11, 'temp1_input')

    print(time.monotonic() - t0, t_gfx/100, t_soc/100, real_t_skin, t_ddr0, t_ddr1, dram_reads, dram_writes, file=outfile)
    outfile.flush()

    time.sleep(1)


# gnuplot:
"""
set terminal x11 noraise
set y2tics
set ylabel "temps, C"
set y2label "bw, GB/s"
plot "metrics.txt" using 1:4 with lines title "t skin", "metrics.txt" using 1:5 with lines title "t ddr0", "metrics.txt" using 1:6 with lines title "t ddr1", "metrics.txt" using 1:(($7+$8)/1000) with lines title "bw" axis x1y2
"""