12-15 C core delta sounds like it’s on the edge, maybe fine, maybe not. I’d be interested if it gets worse over time and what benchmark scores you get.
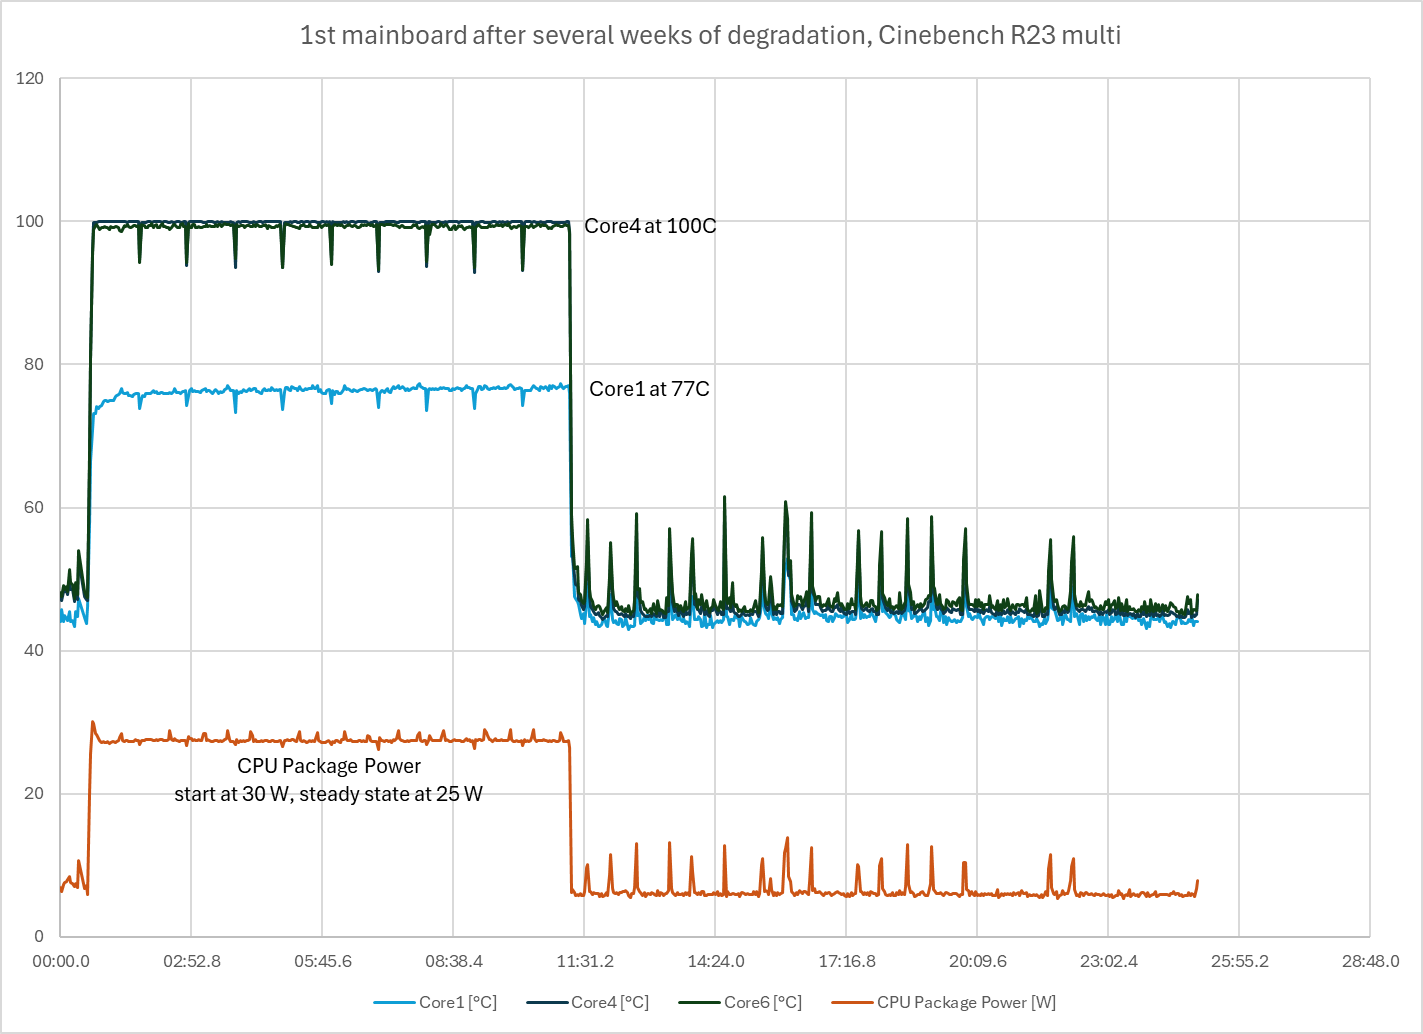
To me what really matters is whether you’re getting the performance you paid for, within some margin of error. For example I started out getting significantly lower Cinebench R23 score than NotebookCheck, and it kept getting worse. And also strangely, setting Windows “Power mode” to “Best performance” got worse scores than when set to Balanced. Also, “CPU Package Power” in HWInfo was reporting only ~28W of usage during benchmarks.
With replacement board it still doesn’t quite match NotebookCheck but it’s close enough for me without more data and with my room being at 75 or 80F or something like that. And I am beating the single-threaded scores, which is probably more important for my most common usage anyway. And now “CPU Package Power” starts out over 55W and is still pulling 46W at the end of the benchmark.
- NotebookCheck https://www.notebookcheck.net/Radeon-RX-7700S-performance-debut-Framework-Laptop-16-review.790807.0.html
- NotebookCheck https://www.notebookcheck.net/AMD-Ryzen-7-7840HS-Processor-Benchmarks-and-Specs.680876.0.html
- Linus Tech Tips https://youtu.be/eUCm4wKarpQ?si=_nrEx3snVh_78qmj&t=608
- Framework forum
| Benchmark | Linus Tech Tips w/ 7840HS | Snipe w/ 2nd 7840HS <9C diff | PSierra w/ 1st 7840HS <15C diff | NotebookCheck w/ 7940HS | Me w/ 1st 7940HS | Me w/ 2nd 7940HS <12C diff | Elliot_Lu w/ 1st 7940hs <13C diff |
|---|---|---|---|---|---|---|---|
| Cinebench R23 Single | 1700 | 1733 | 1740 | 1763 | |||
| Cinebench R23 Multi | ~15000 | 14740 | 16519 | 14744, over a few weeks dropped to 12719 | 16054 | 14300 | |
| Cinebench 2024 Single | 100 | 105 | 106 | ||||
| Cinebench 2024 Multi | 875 | 860 | 916 | ||||
| Geekbench 6.2 Multi | 11591 | ||||||
| Geekbench 6.2 Single | 2389 |
Here are two graphs I made with CSV logging from HWInfo: